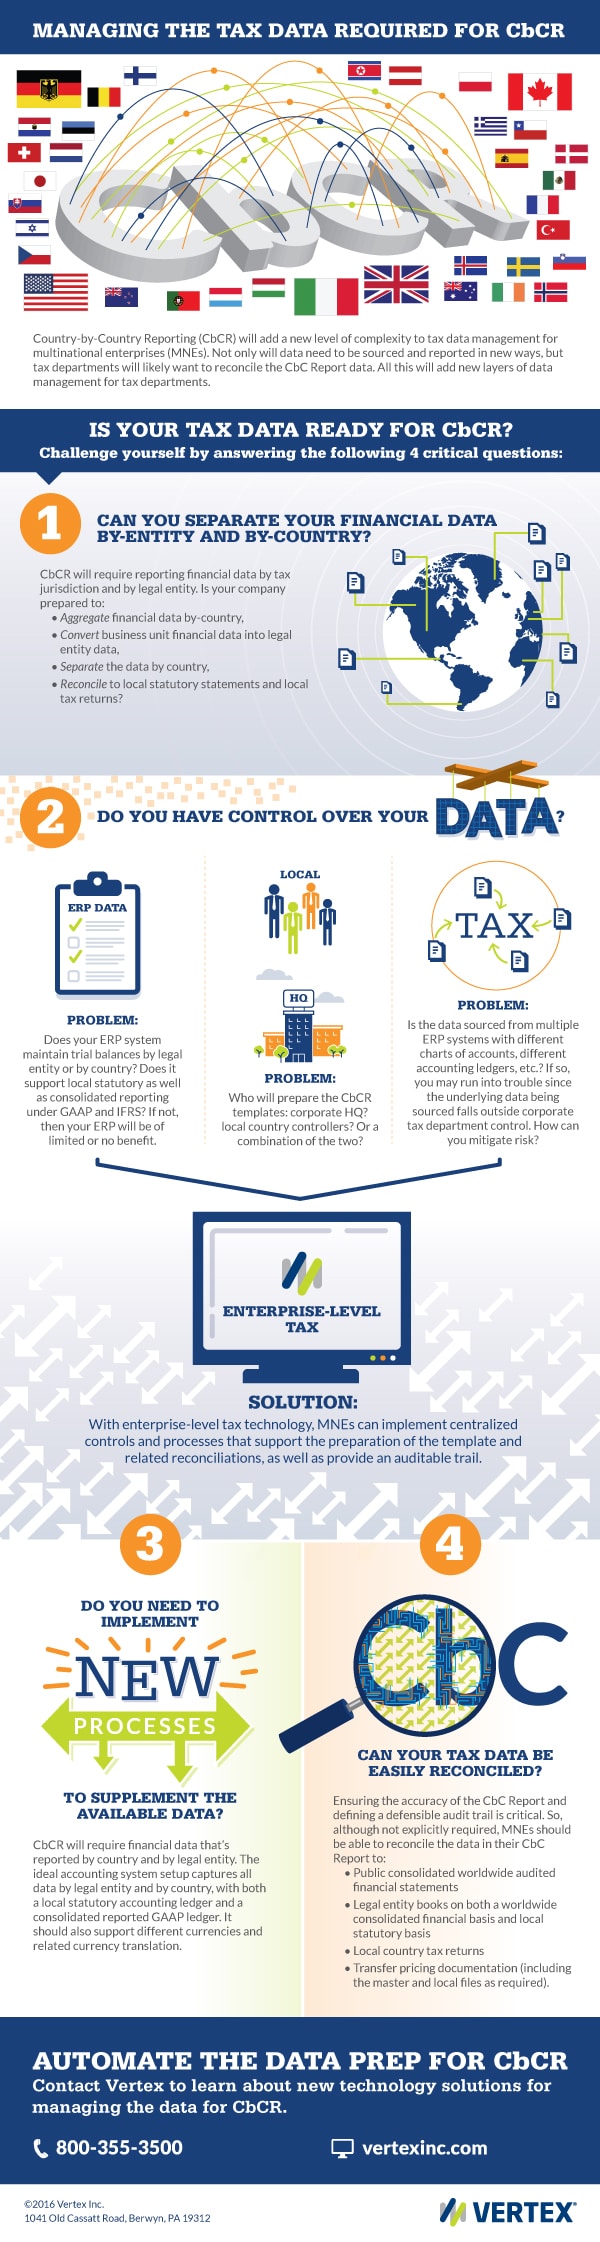
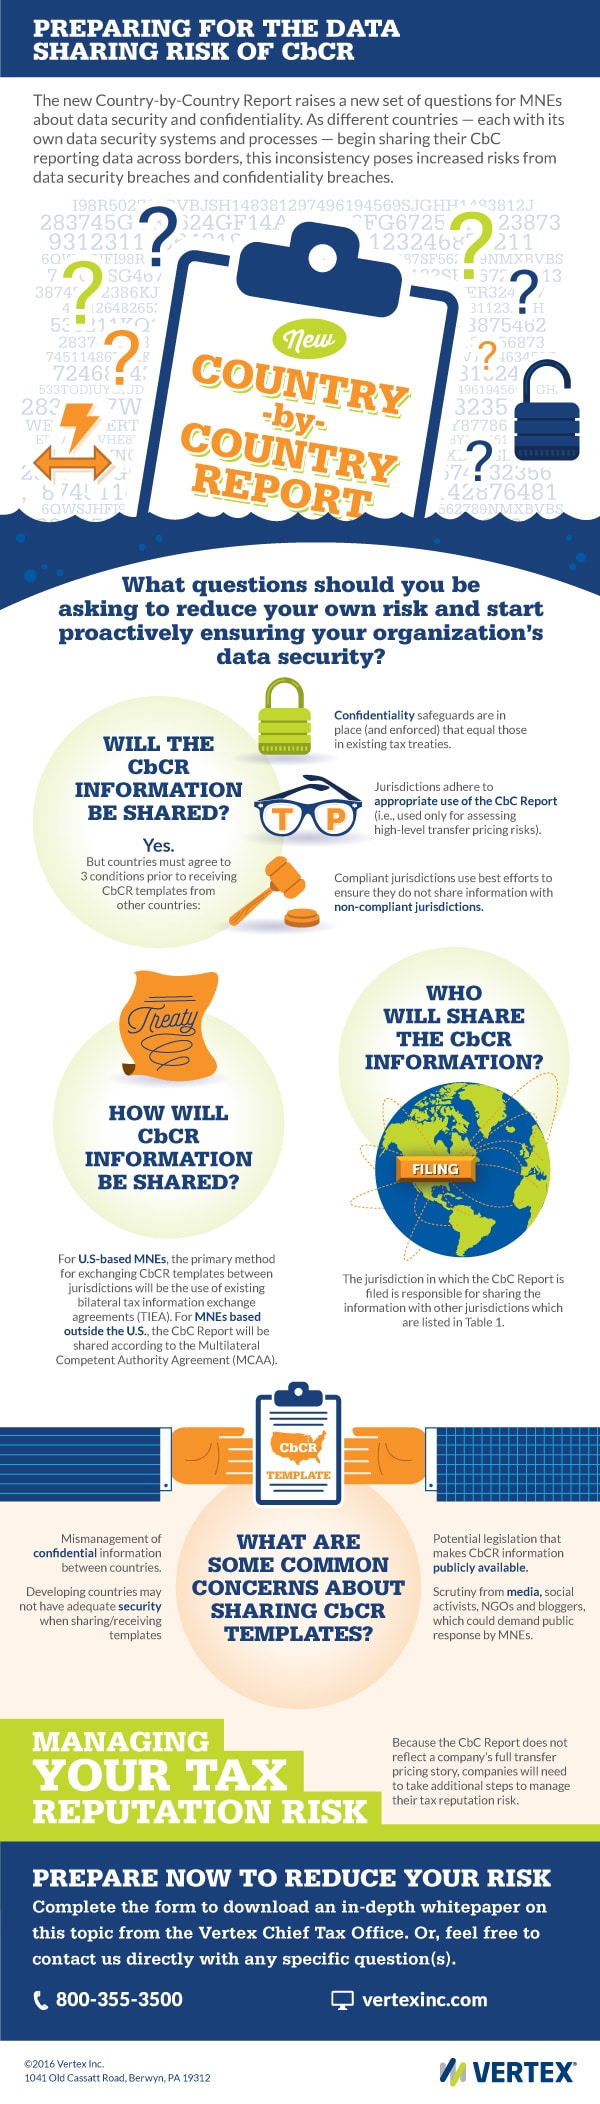
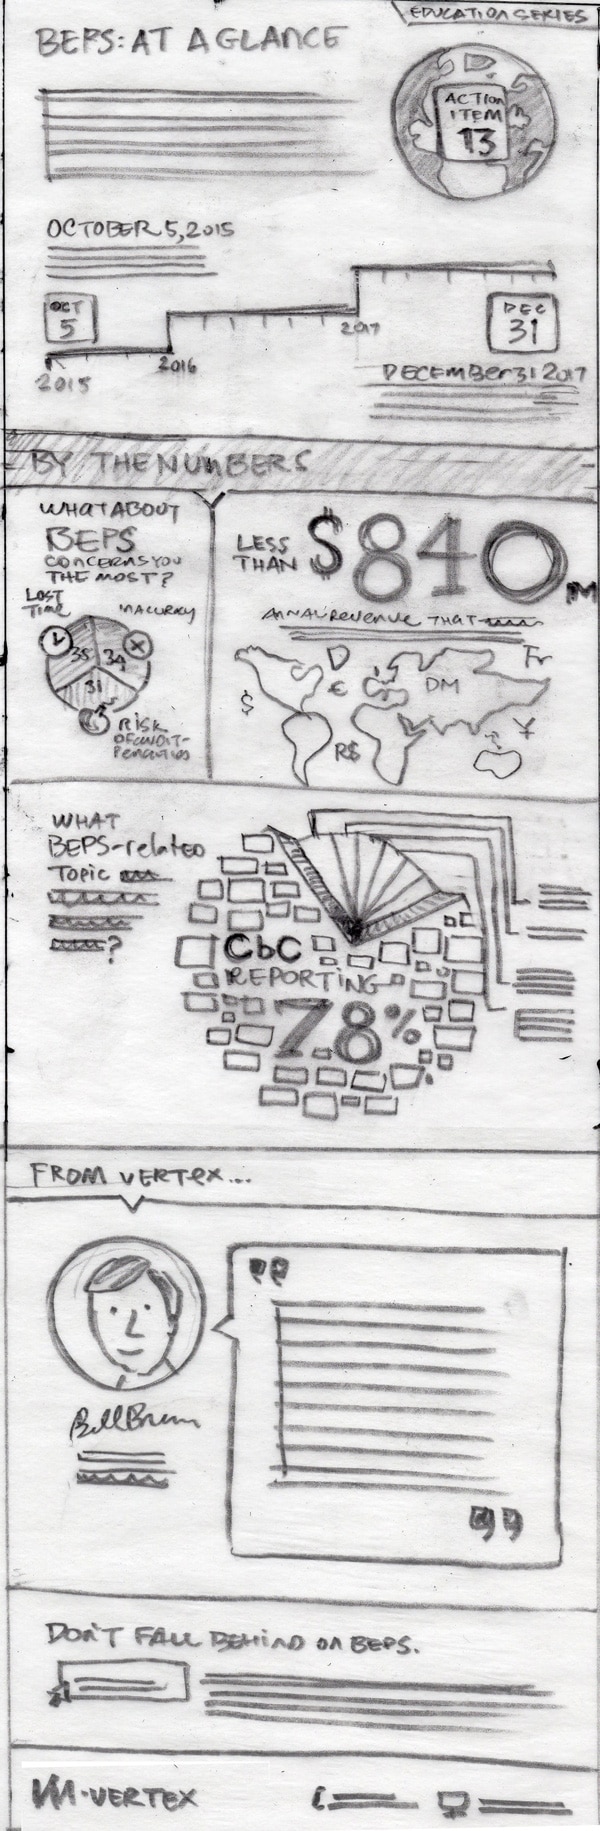
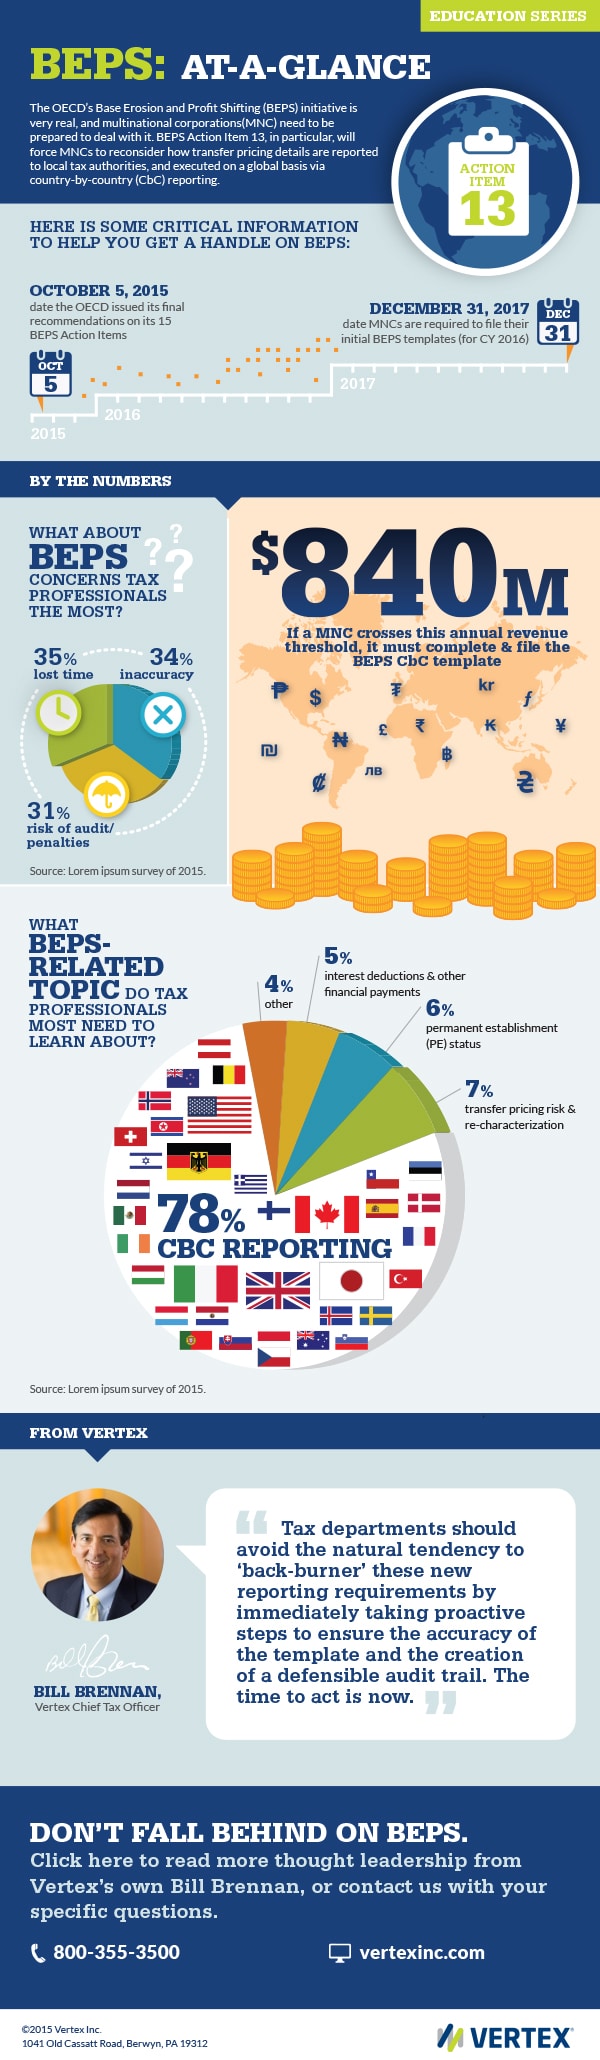

Working with IMA we created a series of Infographics for Vertex to use in their resource center. The graphics take complex tax subjects and attempt to explain them in a very clean, telegraphic and energetic way. We always started with solid client input and a great script, then we developed the custom graphics based on an approved concept sketch. Here’s the ones we created together:


We use cookies to improve your experience on our site. By using our site, you consent to cookies.
Manage your cookie preferences below:
Essential cookies enable basic functions and are necessary for the proper function of the website.
These cookies are needed for adding comments on this website.
Google reCAPTCHA helps protect websites from spam and abuse by verifying user interactions through challenges.
Statistics cookies collect information anonymously. This information helps us understand how visitors use our website.
Google Analytics is a powerful tool that tracks and analyzes website traffic for informed marketing decisions.
Service URL: policies.google.com (opens in a new window)
Clarity is a web analytics service that tracks and reports website traffic.
Service URL: clarity.microsoft.com (opens in a new window)
You can find more information in our Cookie Policy and Privacy.